

Adding Jasper Report Templates#
Jasper Report Template Design Overview#
Designing and deploying report templates for Allegra is a five-step process:
Download an existing template similar to the one you like to create from the Allegra server.
Download some sample report data from the Allegra server to your local disk in XML format.
Start JasperSoft Studio and point the data source to the sample data you have just downloaded.
Interactively design and test your new template locally, using the sample data as test input. Repeat until you are satisfied with the result.
Put all report template files plus some descriptive files into a single ZIP file and upload it to the Allegra server.
You can skip the first step if you want to start from scratch. Of course, you can skip the last step if you are satisfied with creating only local reports. In this case, your report template cannot be run directly on the server, and will not be available to others.
Installing JasperSoft Studio#
JasperSoft Studio is freely available as a ZIP file for non-Windows-based systems, and as an installer executable for Microsoft Windows-based systems.
You must obtain a version that is compatible with the library version used by Allegra.
The library version is displayed under the Administration > Server administration > Server status.
Compatible means that it should not be much newer than the Allegra library version as it then may generate
code that cannot be handled anymore by the older library.
Step 1: Downloading Existing Template from Server#
Usually, it is easier to create a new template from an existing one, rather than start from scratch.
Allegra comes with some ready-to-use report templates.
Log in and go to Reports > Public.
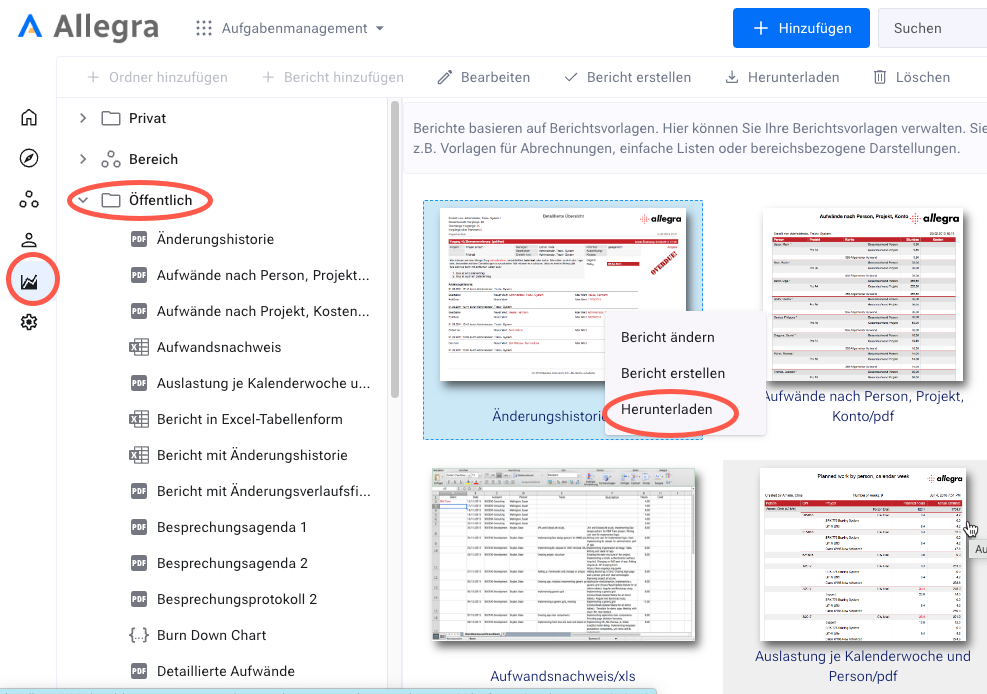
From the list of available templates choose one and download it to your local computer by clicking on the
Download entry in the context menu.
The file you have downloaded is a ZIP-file. To use it you need to unpack it using a ZIP utility like 7-Zip or the Windows unzip utility. Once you have unzipped the file there will be several files as shown below (here we have unzipped the existing template “Standard weekly report”).
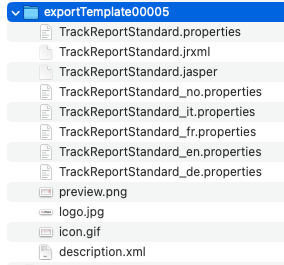
We will take a look at the purpose of each of these files a little later on.
Step 2: Downloading Sample Data#
It is very convenient to test your reports during the design process using sample data. Typically, you will in a rapid fashion repeatedly make changes to your template design, compile the template, and run the report to see what the result looks like.
To make sure that your report template matches the data format provided by the Allegra server, you download an XML file from a query you executed on the server. If your report template runs to your satisfaction on your local computer, you can be sure that it will also run with no problems on the Allegra server later on.
To create a sample data set, run the report using a filter. Click on “Create report”, then choose a filter. Check that the data set you get is representative, and should not be too small or too large. It should be large enough to create at least two pages of output, and should not be too large to not slow down the rapid development cycle.
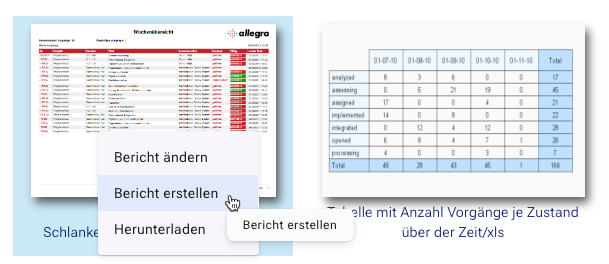
Check that you get a suitable result set with this filter by clicking on “Create report” at the bottom of the filter configuration pop-up window.
Then create the XML data set by repeating the procedure and saving the result to an XML file by clicking on “XML data source” button at the bottom of the filter configuration pop-up window.
Step 3: Creating the JasperReports Project#
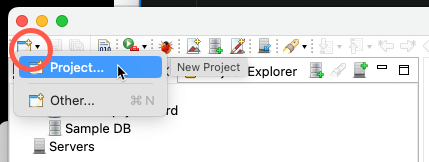
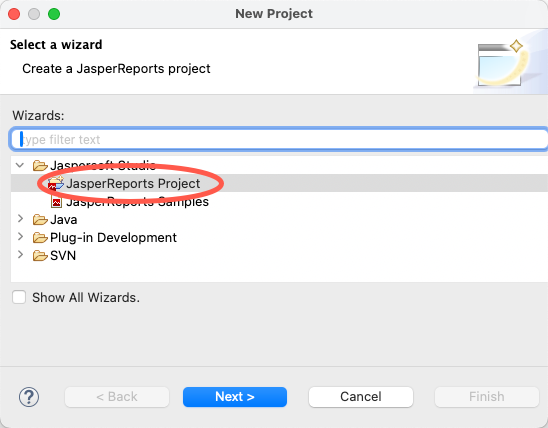
To develop your template you have to create a JasperSoft Studio project. Open JasperSoft Studio.
Go to File > New > Project.
On the next screen select “JasperReports Project” and click “Next”. Give a name to the project and save it.
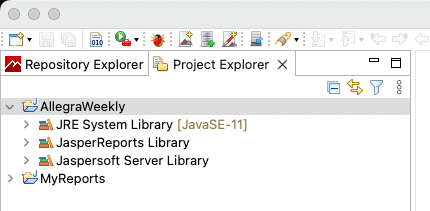
You have now a basic project structure.
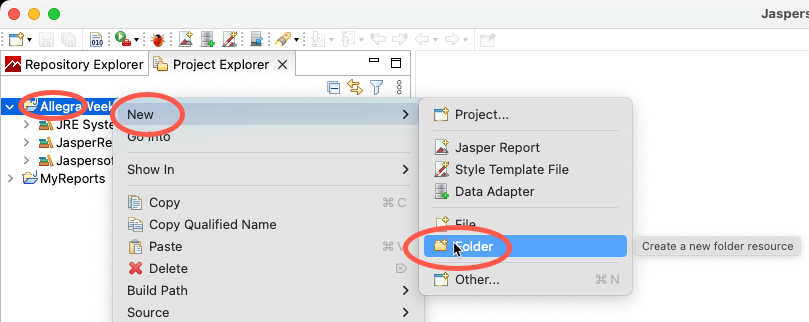
Add a new source folder named src by using the context menu, New > Folder.
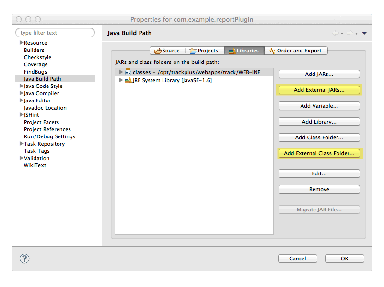
Use the context menu on your new project in the left navigation area to modify some project properties.
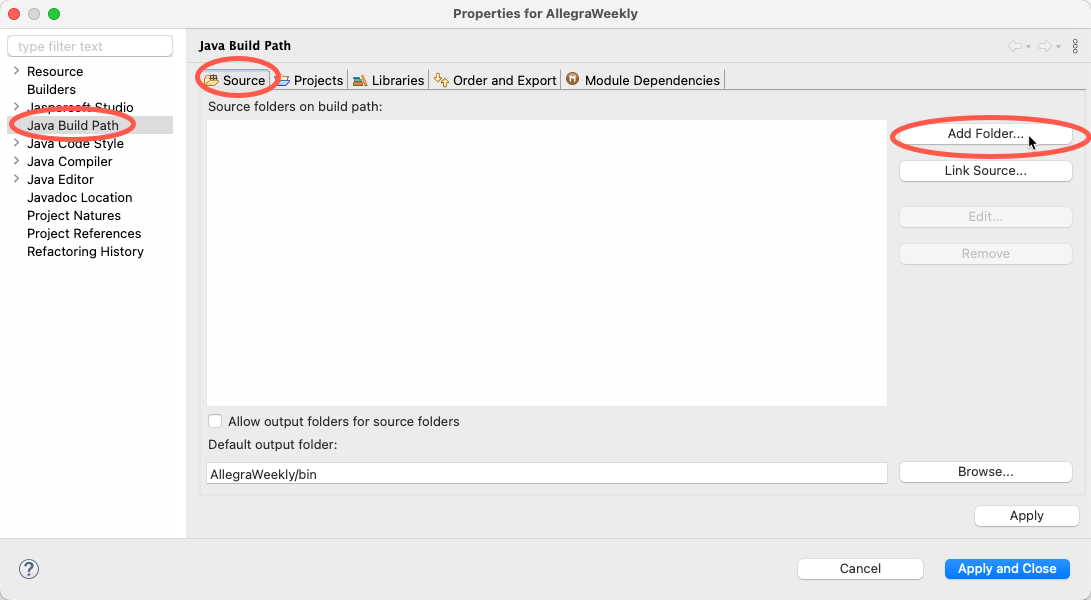
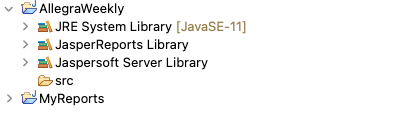
Add the src folder you just created to your Java build path.
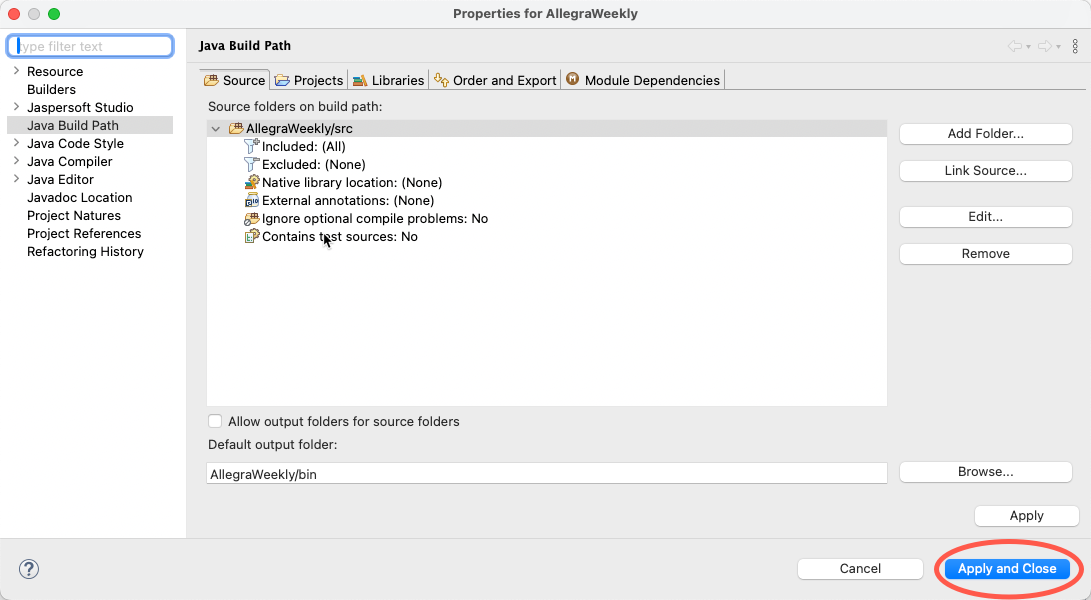
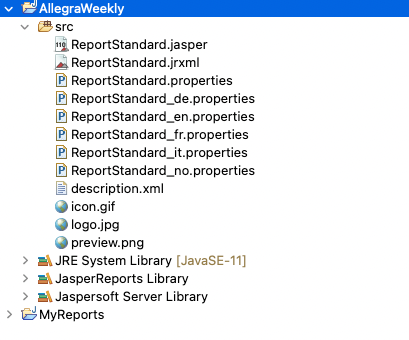
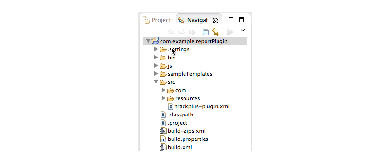
Copy the content of the expanded ZIP file you downloaded previously into your src folder. Your project should now look
like shown here.
Step 4: Configuring the Data Adapter#
It is convenient to test your reports during the design process using sample data. To test the report templates with real data you have to provide a data source.
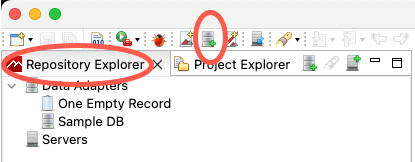
JasperSoft Studio supports a variety of data adapters, but only the XML adapter is useful if you are designing templates for the Allegra server. Switch to the Repository Explorer view and click on the icon marked below to define a new data adapter.
Select the XML document data adapter.
A new form appears that permits editing the properties of your new XML data adapter. Enter the values as shown below. For the XML file, you enter the path for the file that you had previously downloaded from your Allegra server.
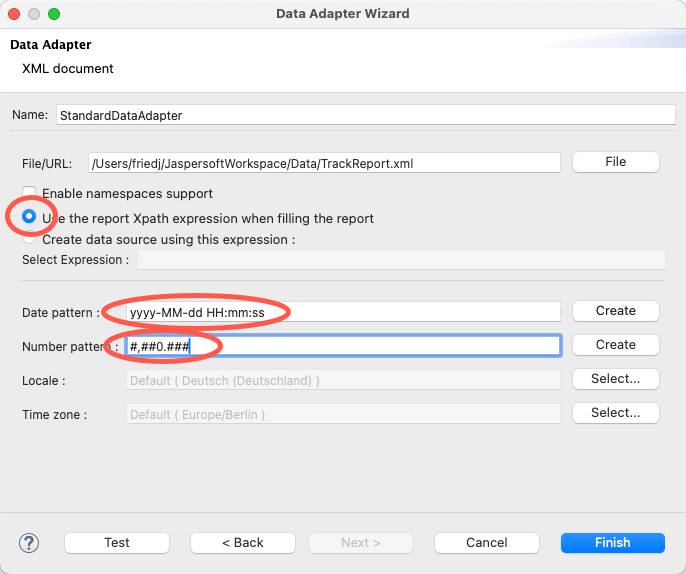
Test your adapter and click on “Finish”.
You can now test if everything has been set up correctly. Double click on the .jrxml
file in your project, like ReportStandard.jrxml. In the design window, you will
see the corresponding template.
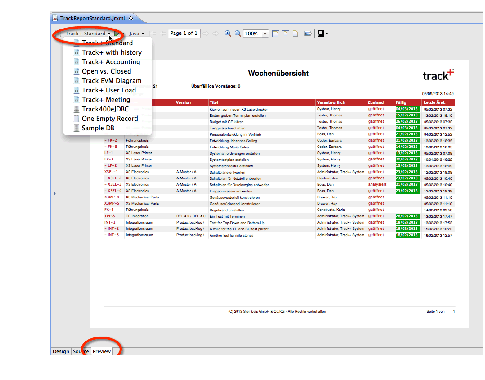
Switch to the “Preview mode” at the bottom of the design area. At the top select the data adapter you have just defined. Then click on the little green arrow next to the data adapter selection list.
You will see the report with your sample data just as it would appear on the server. You can try different output formats. The respective programs like browser, Word, or Excel you need to configure for your JasperSoft Studio installation.
Step 5: Designing the Report Template#
It is most efficient to start with an existing template when going about designing a new one.
To start the design process, double-click on the jrxml file you want to take as a start.
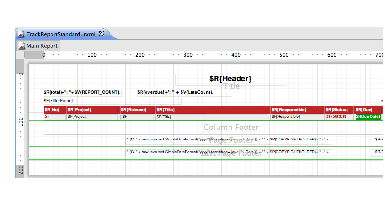
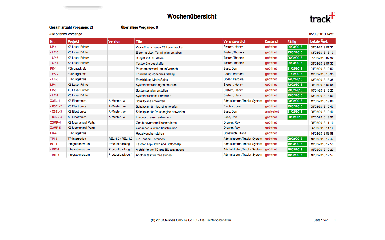
On the screen, a view similar to that shown below appears. Reports are made up of “bands”. The document structure, showing these bands can be seen in the window on the left named “Document structure”. For example, there is a title band, a page header band, a page footer band, and a last page footer band which can be conveniently used to print sums.
The actual report data is placed into the detail band. When running the report, the detail band is generated for each issue.
Example 1: Changing the Report Logo#
As a first example let us try to change the logo that appears at the top right of the first report sheet. You can see that the logo in the template is placed in the “title” band.
Click on the image and go to the “Properties” windows on the lower right.
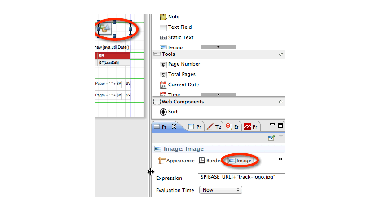
Go to the “Image” section. Here you see the name of the image file that is being included. The way it is shown here it refers to the file that is placed directly in the template directory. The parameter $P{BASE_URL} is required so that later on the system can find the image file at the proper place.
In our example, the image file is JPEG encoded and has a size of 253 x 121 pixels. However, the image is scaled down to half its size (126 x 60 pixels) in the report template, which you can see on the “Common” tab.
You can now place your own logo image file into the template directory, include it in the template, and scale it to the size you like. It is recommended to use JPEG or PNG-encoded files for images.
Once you have changed your template save it to disk (menu File > Save). Then switch to the preview tab.
If you have made any errors, you will get error messages in the bottom window.
After a little while the report should show up in the viewer program configured. In our example, an Acrobat reader would be started and the report would be displayed there.
If this was all you wanted to do, proceed to Step 6 to deploy the modified report template on the server.
Example 2: Inserting a Custom Field#
The report engine itself executes a query on the report data provided to it before assembling the report. In the case of an XML data source, as it is being used by Allegra, the query is expressed in terms of an XPath path expression. The leaf nodes of the resulting data set are mapped to JasperSoft Studio “fields” which then can be used in the report template.
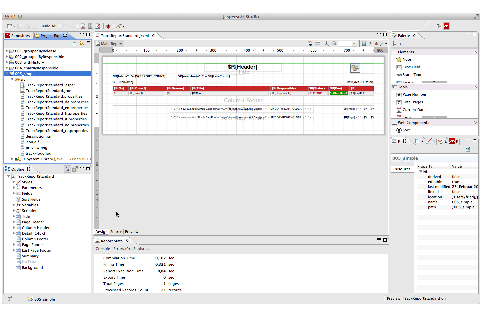
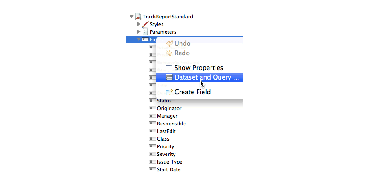
To map fields in the XML data set coming from the Allegra server to JasperSoft Studio fields, click on the “Fields” node in the lower left navigation area. In the context menu select “Dataset and Query”.
You see the XPath expression of the current template and the result set of this query.
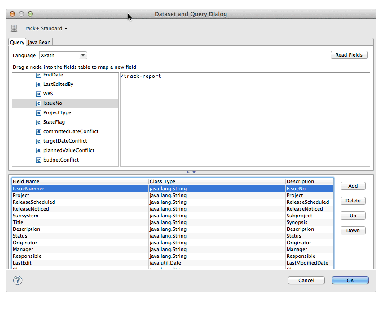
In the illustration, we have selected a node labeled “IssueNo”. If you look at the bottom section of the same window you see a table where this field “IssueNo” is mapped to a template field named “IssueNumber”. Furthermore, it is defined that this field is of type String.
You can add your own fields to your report template by dragging them from the result node area to the
fields table at the bottom of the window. From then on, you can refer to these fields using the
placeholder $F{yourfieldname}, for example $F{IssueNumber}.
Step 6: Deploying Report Templates on the Server#
Once you are satisfied with your report template design you can deploy the template on the Allegra Server. This enables you and possibly others to have a nicely designed report created directly from a report overview on the server, without having to download and configure anything locally.
Before you publish your new template to the server, make sure that all required files are in one directory. Please pay attention to the following:
Most important, you have to have the compiled report template file in the template directory. The compiled report template files have the ending
jasper. We have set up our project such that they appear in thesrcdirectory.Make sure you have a preview image of your report with some sample data, about 800 x 550 pixels. For convenience, call it
preview.gif. This enables the users of the Allegra system to have a look at how the report would look without actually executing it.Check that the proper texts are shown in file
description.xml.
Now place all files in the src
directory into a ZIP file. Make sure that all files are at the topmost level of the ZIP file
and that there is no directory at the top level. You need to ZIP the files, not the directory.
After you have created a ZIP file with the structure as shown above, log in to the server. Go to Reports and upload your report template.
Advanced Preprocessing with XSLT Style Sheets#
The Allegra XML data file format may not be suited for a particular report idea that you have. For example, the standard data structure does not support to print a pie chart on the number of issues assigned to each responsible, or other similar presentations relying on summarized data.
Nonetheless, you can create reports like that by preprocessing the original XML data file using an XSLT style sheet and a style sheet processor. Once you have tested your style sheet and report, you include the style sheet into the report zip file, add its name to the report description file, and when you execute the report on the server, it will use the same style sheet before it creates the report!
There is an example in the JasperSoft Studio distribution that uses a style sheet to create a pie chart report. In order to test and execute your style sheet you have to install a style sheet processor on your development computer. The Allegra server uses the Xalan processor which is freely available, so it may be best to use that as well on your client. We will refer to this processor in the following.
The procedure to create reports based on your own data structures is as follows:
Download some sample report data from the Allegra server to your local disk in XML format.
Develop your style sheet and create a new XML data file from the original XML data file, using the XSLT processor.
Start JasperSoft Studio and point the data source to the sample data you have just created using your style sheet and the style sheet processor.
Interactively design and test your new template locally, using the sample data as test input. Repeat until you are satisfied with the result.
Put all report template files plus some descriptive files and your style sheet into a single ZIP file and upload it to the Allegra server.
This process is the same as outlined before for reports without data preprocessing, except for the additional step of creating your own XML data file and pointing your data source towards it. Furthermore, you have to add your style sheet to the report package that you upload to the server.
You can run the Xalan style sheet processor from the command line like this:
java -classpath <yourPathTo xalan.jar> \
    org.apache.xalan.xslt.Process -in xmlSource \
          -xsl stylesheet -out outputfiles
For example, if you have installed the Xalan jar file (xalan.jar) in C:Program FilesXalan, and you use the original exported file from Allegra, you would enter:
java -classpath C:\Program Files\Xalan\xalan.jar \
          org.apache.xalan.xslt.Process -in TrackReport.xml \
          -xsl chart.xsl -out TrackChart.xml
Adding Report Data-Sources#
It can be difficult to get a good and efficient data source from the standard data structure. For example, accounting reports or reports that should show some development over time are tedious to generate from the standard data structure even with the XSLT preprocessing facility.
You can create custom (Java) code, drop it into the Allegra application library directory, and you can run reports on anything you like. The custom data source can include a user interface, for example, to select parameters such as reporting period, grouping, or whatever you need.
The Java class to be used for the data source needs to be declared in file description.xml,
mentioned above. Just include the data-source name in a tag named datasourcePlugin, like this:
<datasourcePlugin>com.yourCompany.YourReportClass</datasourcePlugin/>
This section introduces you to developing your own data sources.
Development Process Outline#
To develop a custom data source, follow these steps:
Using one of the existing templates or starting from scratch design your new report template as described above. This template should make use of your new, not yet existing data source. In the first step you do not have data to fill it, this you will do later on. Upload this template to your local Allegra installation.
Starting with the Report data-source Development Kit and following the procedure described above write the Java code and optionally JavaScript code for your new data-source.
Execute (“Run As Ant Build”) the
build.xmlfile in your project.Restart your Tomcat from within Eclipse in Debug mode.
You can now debug your code.
Repeat 2 to 5 as necessary. When you are done you will find the deployable tpx file in the
distdirectory.
Step 1: Install Allegra on your Development Computer#
To develop data-source plug-ins you have to properly set up your development environment. In the first step, you install Allegra on your development computer and get it to run properly. This way you have an Apache Tomcat and a database installed.
Follow the instructions for a manual install as described in the installation guide. In the following we assume you have configured
TRACKPLUS_HOMEto/opt/trackplus. On Windows computers it is typicallyC:\Program Files\Trackplus. Start your system and make sure that everything works. Save your Torque.properties fileCreate a directory
/opt/trackplus/webapps.Place the Allegra WAR file (
allegra-8xxx.war) intoopt/trackplus/webapps `` and call it ``track.war
Step 2: Configure your Eclipse IDE#
Follow the instructions in section ref{sec:tools} to configure your development environment.
Configuring the Data-Source Project#
In Eclipse go to
File>New>Projectand create a new standard Java project to develop your data source in.
You need to adjust the Java build path of the project to compile. Add the the
/opt/trackplus/webapps/track/WEB-INF/classesdirectory to the build path and all libraries (jar files) in/opt/trackplus/webapps/track/WEB-INF/lib.
Edit the entries in file build.properties. Note in particular that the data-source jar name in this file needs to match the JavaScript package name you use for your user interface classes! If in
build.propertiesyour data source jar name ismyPackage, and you need JavaScript classAccounting, you must useExt.define('myPackage.Accounting',{...for your JavaScript class.Right click on
build.xmland select “Run As” “Ant Build”.Select the Tomcat server project. Configure the Debug configuration as shown below.

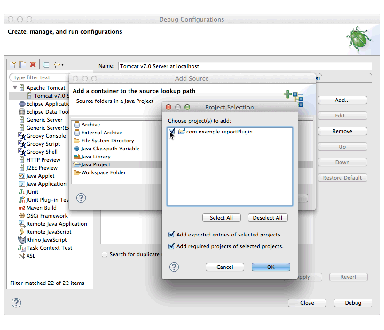
Start the Tomcat server from within Eclipse in Debug mode and debug your data source.
Jasper Report Data-Source Elements#
A report data source serves to deliver an XML data structure to a JasperReport template. It consists of
an optional JavaScript user interface to configure data-source parameters, like selecting a project or users or accounts.
an optional application logic to handle the parameter setting process via the JavaScript code.
business logic that generates the XML data structure that can be used by the associated JasperReport templates
A single data source may be used by any number of JasperReport templates.