Traffic Light Diagram#
The traffic light diagram graphically illustrates the status of a project in terms of its schedule adherence, its effort and its quality. The criteria for red, yellow, and green are selectable.

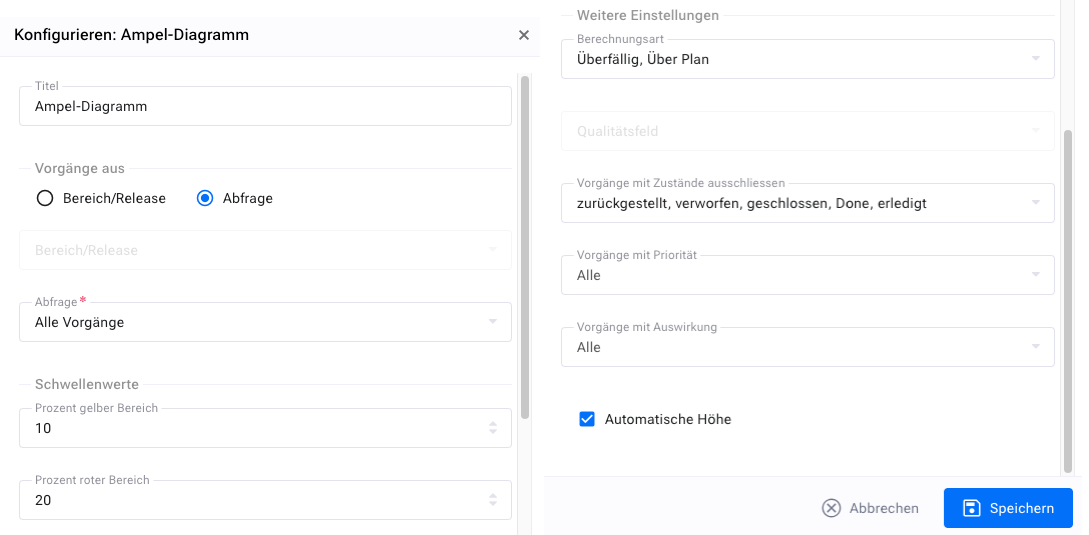
The traffic light diagram widget offers the following configuration options:
Filters, which workspaces or items should be taken into account
Selection, which of the three categories “schedule”, “effort” and “quality” should be represented as “overdue”, “over plan” and “insufficient”
The past period that should still be taken into account. Items before that are no longer counted, as they are considered no longer relevant for the current project status
The percentage of problematic items, from which the project is displayed as “yellow”
The percentage of problematic items, from which the project is displayed as “red”
The states that mark an item as completed
The attribute name for the “quality” criterion
The configuration of the widget looks as shown below.

To calculate the “schedule” criterion, items that are not completed according to the configured states for “completed” and whose end date or desired date is exceeded are marked as problematic. Items whose end date is behind the desired date are also marked.
To calculate the “effort” criterion, items are marked as problematic whose projected effort, i.e. the sum of already incurred effort and the estimated remaining effort, is above the planned effort. Items whose planned effort is above the budgeted effort are also marked as problematic. To calculate the “quality” criterion, it is necessary that the items to be considered have a corresponding field configured on the “edit” mask. The attribute type “quality” must be of the type “simple selection list” and allows the marking of items that have been marked as completed, but do not have the desired result. Three values are possible (the names can be changed, the meaning depends on the order):
unknown
okay
insufficient
Items are marked as problematic whose quality has been marked as insufficient.
