Monitoring a project with burndown charts#
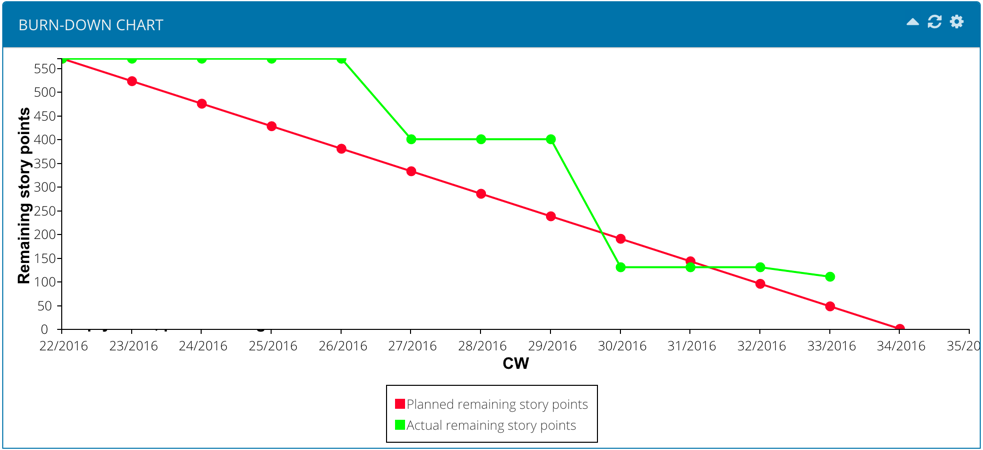
In Scrum, you monitor work progress with burndown charts.
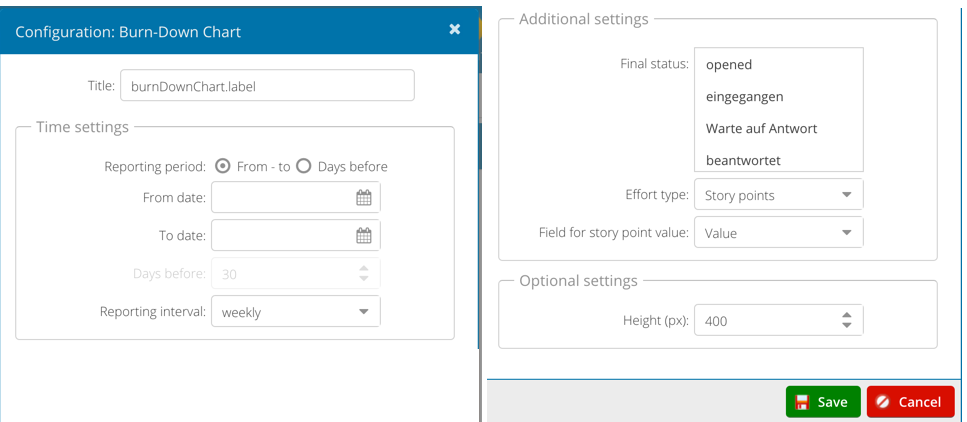
Burndown charts relate to products, releases, or sprints. To configure a burndown chart, select the desired phase (release or sprint).
Note
Note: Make sure that your release or sprint has a start date and an end date. These dates determine the time period for the chart!
Select the reporting interval and define which states are considered “done”. For the y-axis you can choose the number of items or any numeric custom attribute, such as story points or the effort (workload).