Working with the Gantt chart#
wsman sysman sysadmin
The interactive Gantt chart is well suited for displaying and editing the timeline of a plan, dependencies, and the visualization of project progress. In the Gantt chart, the plan, the baseline, or both together can be displayed.
To create or edit a project plan, go to the Project management perspective > Gantt chart.
Important
For the plan, use exclusively the item type “Task” or another item type with the type flag “Task”. Other item types are not displayed in the Gantt view.
Click Gantt view in the main menu. On the left, select the workspace you previously created for your new project. Note: in order to use the Gantt view, this view must be enabled for the respective user on the user management page (see Managing regular users).
Focusing and scaling#
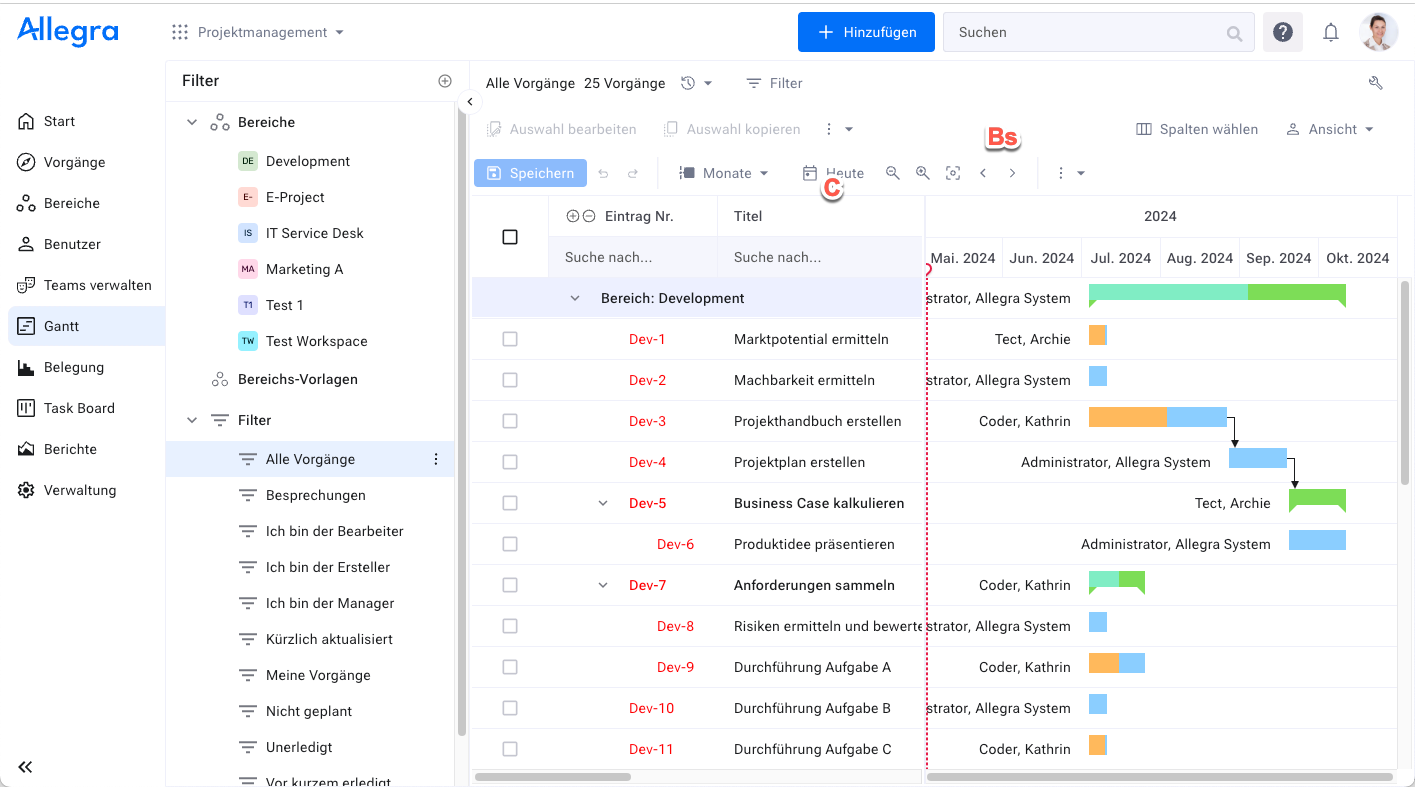
You can focus the chart on a specific item by selecting it in the table on the left by clicking the item number.
Using the Today button in the settings area (C), you can focus the Gantt chart on the current date.
Using the time range selector (B), you can scale the time axis.
Creating an item#
To create an item, click the New item button in the top toolbar.
Select your new project and the item type “Task”.
Enter a title and fill in the other fields as needed.
Save the item.
For additional items, select the first item in the list. Use the keyboard shortcut CMD + or whatever you use in Excel to add a new task directly below another one. Fill in the details directly in the table area. You may want to rearrange the columns to show the ones you need most.
You can create subtasks via the context menu of the items in the table area, entering the task under which you want to create a subordinate task.
Changing the item hierarchy#
You can rearrange tasks via drag & drop in the table area.
Changing dates#
You can change the start date, the start and end date, or just the end date of a task by clicking and dragging either the left end, the middle, or the right end of the tasks. Weekends and other days off of the assigned responsible are taken into account. When changing the dates of parent tasks, all subordinate tasks are moved as well.
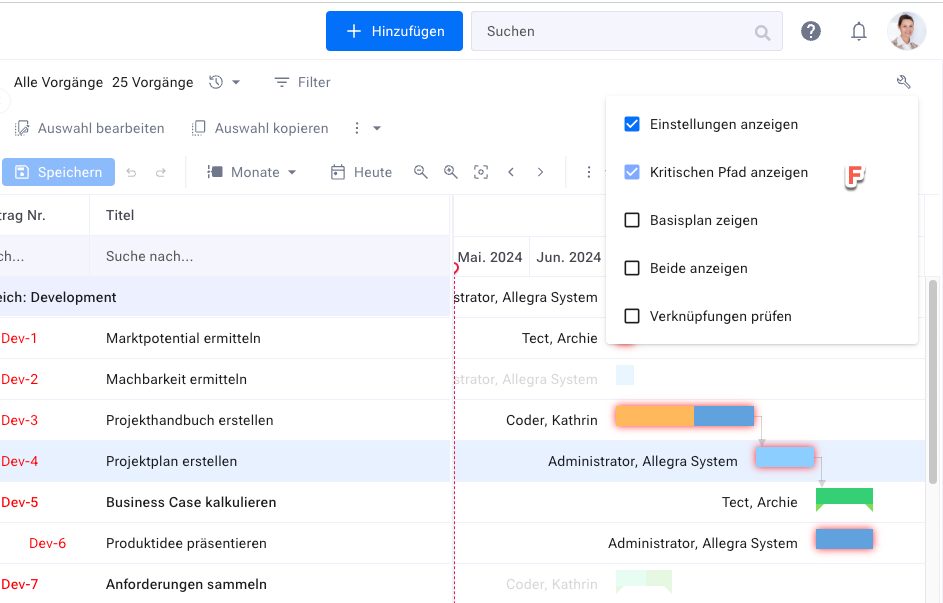
The default configuration is that you change the plan. To change the baseline, open the configuration of the Gantt chart using the “Settings” button at the far top right and select “Show baseline” (F). This is only possible if “Top-down behavior” is enabled in the Administration perspective, see Server administration > Server configuration > Other. In addition, you must have placed the attributes “Target start” and “Target end” on your input forms.
To add item dependencies, click the right end of the source item and drag the line with the mouse to the left end of the successor item.
When you are done, save your plan using the Save button at the top of the action menu.
Marking the critical path#
To mark the critical path, open the Settings area of the Gantt chart at the top right and select the Show critical path check box (F).
Removing unnecessary delays (normalizing)#
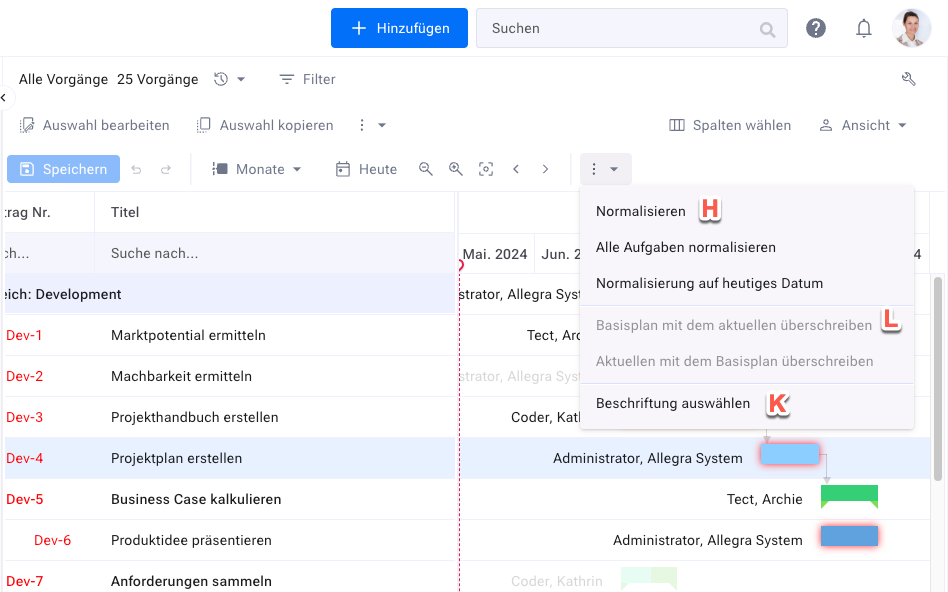
To correct unnecessary delays or faulty finish-to-start relationships, click the Normalize button (H).
The “Normalize” menu entry only considers items that have not yet started.
“Normalize all tasks” also adjusts items in the past.
“Normalize to today’s date” sets the earliest date to today, shifts all other dates accordingly, and then normalizes. This is especially helpful for creating projects from templates.
Labeling items#
To label items in the chart, click the (K) Select label button.
Adjusting the baseline to the plan#
To move the baseline dates to the dates currently used by the plan, click the (L) Overwrite baseline with the current one button.
Releasing individual date fixings#
You can temporarily release the fixing of individual dates via the context menu, so that they can be moved.
Backward scheduling#
In backward scheduling, you start from a fixed end date and then conceptually plan toward the start date. The start date is thus derived from the planning.
To schedule backward in Allegra, you first carry out a perfectly normal forward planning with a reasonably plausible start date. This results in an end date that deviates from the desired date. To correct this, select all the associated items and click the “Edit selection” button. There you set the end to “latest date on” and then enter the desired completion date. In addition, select the check box “Adjust start accordingly”.
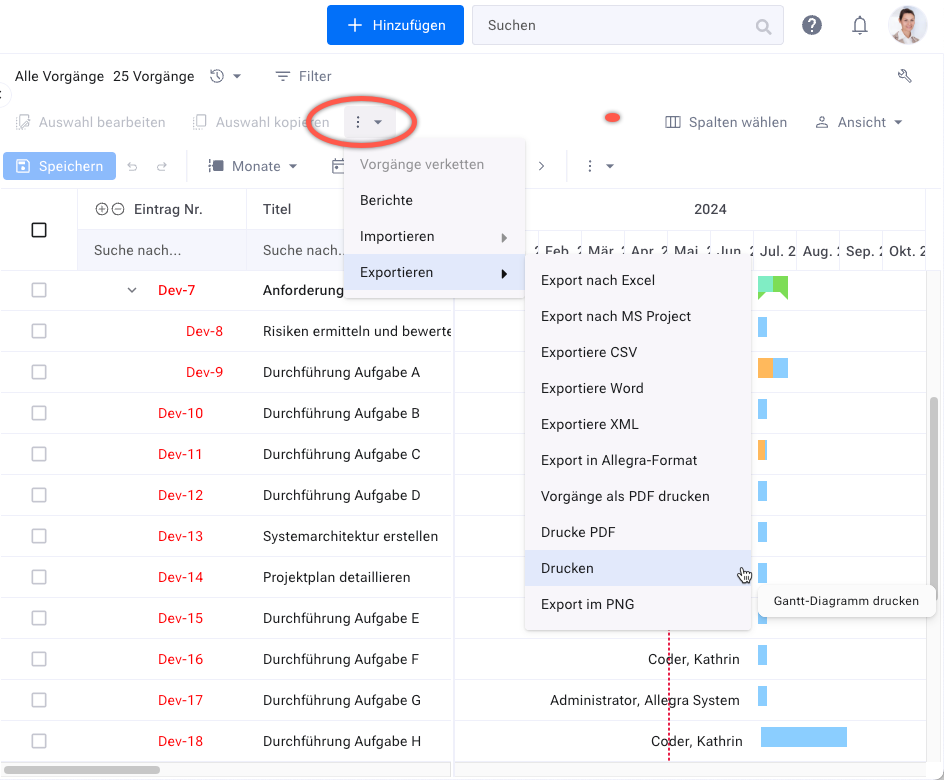
Printing the Gantt chart#
To print the Gantt chart, go to Actions > Export > Print. Set up the printout as desired.