

Milestone trend analysis#
This graphical cockpit widget lets you track how the scheduled dates of important items evolve over time.
Before you can use this widget, you must configure it. Switch to the cockpit and click the “Configure cockpit” button.
Follow the general procedure to configure the cockpit described here, see Working with the cockpit.
From the list of cockpit widgets on the right, select “Milestone trend analysis” and drag it to the desired location in the cockpit.
Then right-click the new widget and select “Configure”.
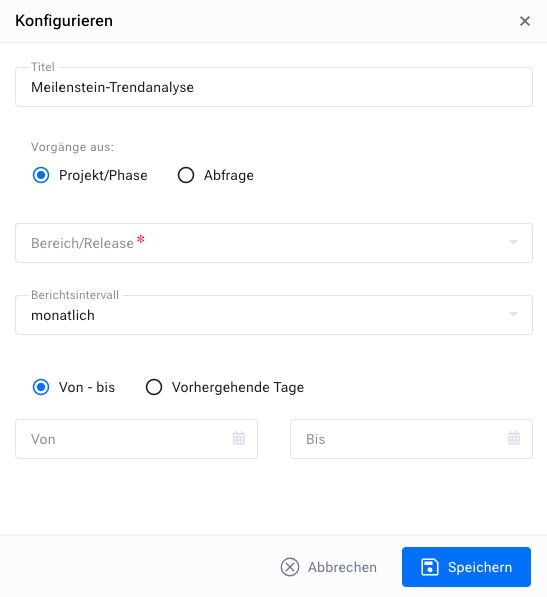
You select a filter that returns only the items (milestones) whose scheduled dates you are interested in.
Then you set the reporting interval. To display the scheduled date of the item as it was published at the end of each week, for example, select “weekly” here.
Finally, you set the reporting period, for example from the start of a project to its end.